Published by The Attractiveness Report · Score v1.0 · last reviewed August 29, 2026.
The attractiveness scale is a 1-to-10 rating scale used to interpret an attractiveness score, where each whole number marks a band, and most measured scores cluster in the 4-to-7 range rather than at either extreme.
This guide explains what each band on your attractiveness score means, plus how a score differs from a percentile and how male and female norms compare. It also translates the scale into casual phrasing like rate me out of 10 and into the separate PSL scale.
The Short Version
What Is the Attractiveness Scale From 1 to 10?
The attractiveness scale from 1 to 10 is an interpretive framework that sorts an attractiveness score into a band from 1 (low) to 10 (high); it does not produce the score itself.
A score and a scale answer two different questions. An instrument, such as an AI facial analysis, produces the score: a single number describing one photo. The scale interprets that score afterward, sorting it into a band, a fixed one-point-wide slice of the scale, so the number means something beyond itself. Scores produced by AI facial analysis are interpreted on this same 1-to-10 scale, whether the photo comes from a phone camera or a studio portrait.
The scale takes three common written forms: a plain range from 1 to 10, a score out of 10, and a fraction such as 7/10. All three name the identical ten-band scale; only the notation changes.
Each band corresponds to a range in the underlying reference population, not to one fixed cutoff. A 6.8 and a 7.1 fall in different bands, yet both describe faces close to that population's own average. This clustering near the middle is not a flaw. Facial attractiveness ratings bunch near the center of the range in study after study. Composite-face research documents the same pattern. Faces built by averaging many individual faces are rated more attractive than most of the faces that go into them, according to a widely cited 1990 study in Psychological Science. The scale reflects that clustering directly, which is why most measured scores land in the 4-to-7 range and a 9 or a 1 is genuinely rare.
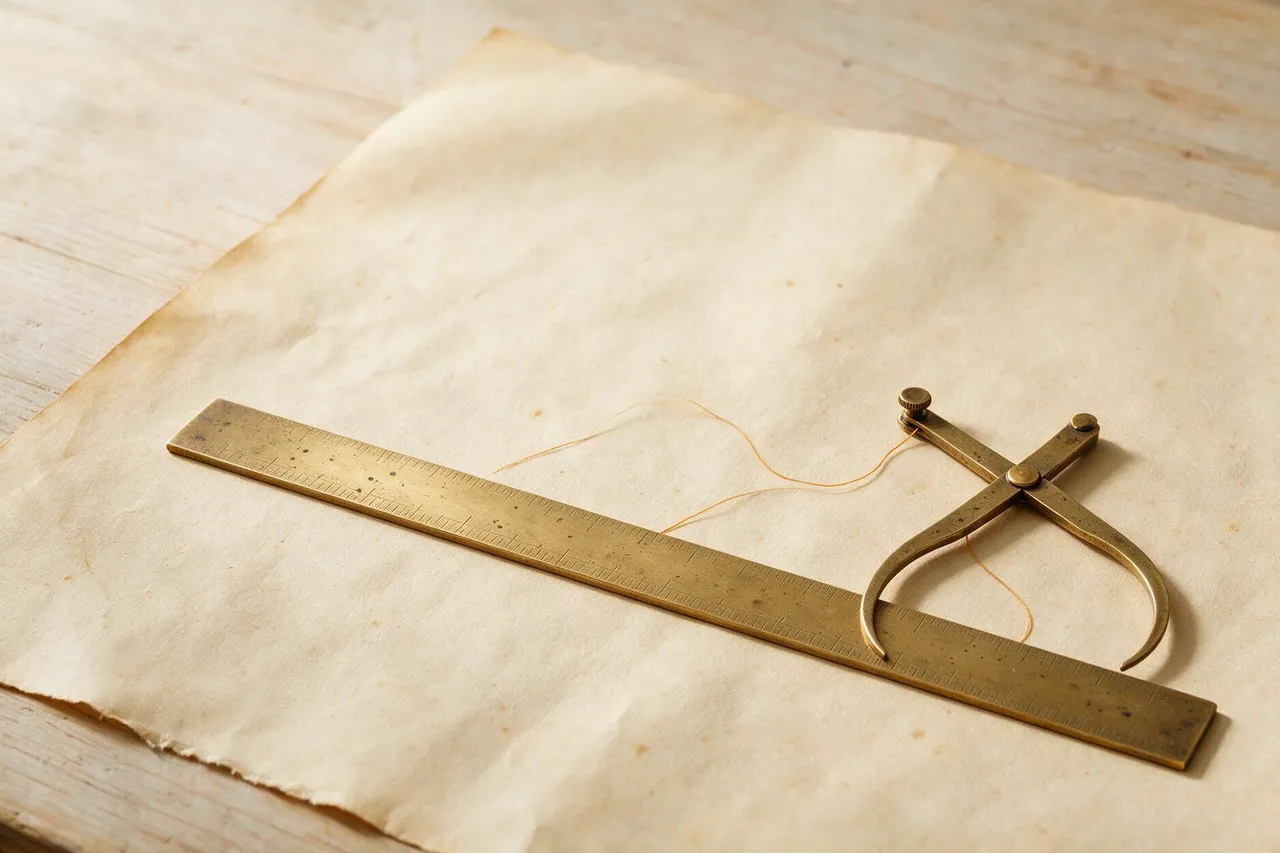
The distinction this page rests on is the one these tools embody. An instrument, a ruler or a caliper, produces a measurement; a scale gives that measurement meaning by placing it against other results. The ten bands below do only the second job. They interpret a score an instrument has already produced, and they state where it sits in a range, never what the number is worth.
What Does Each Score on the Scale Mean?
Each whole number on the scale marks a band. Saying precisely how common each band is would take a percentile, and this site withholds percentiles until a real reference population has been measured and published; no study has scored a large, representative population yet, and no figure is invented to fill the gap. What the rating literature does support is the shape: rating-scale judgments of faces cluster near the middle, with few results at either extreme. So the table below describes each band in plain rarity language instead of numbers, and that language is scheduled for replacement with real scan-distribution data the first time enough scans exist to support it.
| Band | Score range | Plain-language description |
|---|---|---|
| 1 | 1.0 to 1.49 | Extremely rare. Almost nobody measures here. |
| 2 | 1.5 to 2.49 | Rare, at the low end of the scale. |
| 3 | 2.5 to 3.49 | Uncommon, at the low end of the scale. |
| 4 | 3.5 to 4.49 | Below average, but still common. |
| 5 | 4.5 to 5.49 | Just below the midpoint. One of the two most common bands. |
| 6 | 5.5 to 6.49 | Just above the midpoint. The other of the two most common bands. |
| 7 | 6.5 to 7.49 | Above average. The band the phrase is 7 out of 10 attractive is asking about. |
| 8 | 7.5 to 8.49 | Well above average, uncommon. |
| 9 | 8.5 to 9.49 | Rare, at the high end of the scale. |
| 10 | 9.5 to 10.0 | Extremely rare. Almost nobody measures here. |
The table above is the lookup. Find any score from 1.0 to 10.0 in the second column and read its band and description straight across the row, with no photo, no camera, and no signup. A score is a starting line, not a verdict. Don't have a score yet? Get one free with the AI attractiveness test: nothing is uploaded, and the scan runs on your device.
Is 5 Out of 10 Considered Attractive?
A 5 out of 10 sits in Band 5, just below the scale's midpoint, and it is one of the two most common results on the scale. That makes a 5 typical, not below average. No percentile is attached to it here, because none exists to attach until a real reference population is published.
Is 6 Out of 10 Considered Attractive?
A 6 out of 10 sits in Band 6, just above the scale's midpoint, and it is the other of the two most common results on the scale. That makes a 6 slightly above typical, not exceptional. As everywhere on this site, no percentile ships with it until a real reference population exists.
Is 7 Out of 10 Considered Attractive?
A 7 out of 10 is above average on this scale. Most measured scores fall below a 7, which makes it a genuinely high result, not a typical one. How far above average, in percentile terms, stays unpublished until a real reference population exists.
Is 8 Out of 10 Considered Attractive?
An 8 out of 10 is well above average and uncommon, one band below the rarest scores this scale records. Only a small share of measured scores reach it, and no percentile is printed for it until a real reference population exists.
Is 9 Out of 10 Considered Attractive?
A 9 out of 10 is rare: almost no measured score reaches it, and only Band 10 sits rarer. Rare scores raise a different question than typical ones: what actually counts as good.
What Is a Good Attractiveness Score?
There is no single good attractiveness score, because good is a population-relative judgment, not a fixed number. A score of 7 or higher is uncommon on this scale; the 5-to-6 range sits at the scale's typical middle.
Good, on this scale, names a position relative to other measured scores, not a property the number carries on its own. The band table above is the full answer: a 5 or 6 is typical, a 7 is above average, and an 8 or higher is uncommon. Calling one of those good, average, or disappointing is a judgment a reader adds on top of the number; the scale itself only states where that number sits. That distinction matters most at the edges, where a single band, a 4 versus a 5, can separate below average from typical without describing two very different faces. A score, on this scale or any other, is a starting line, not a verdict.
Is the Attractiveness Scale Accurate?
The attractiveness scale sorts a score into a consistent band, but private taste accounts for about half the variance in any single attractiveness rating.
Roughly half of the disagreement between two raters looking at the identical face comes from each rater's own private taste, not from features a panel would agree on. The source is 2006 research in the Journal of Experimental Psychology: Human Perception and Performance. That finding is about the scale's reliability: whether a band boundary means the same thing across raters and re-interpretations, not about whether an AI facial analysis measures geometry correctly. Because roughly half of any rating is private taste, a band is built as a range rather than a single defensible point. Treating a band edge, a 6.49 against a 6.51, as a meaningful difference overstates what the number can support. Accurate, used loosely, usually means a number that stays the same no matter who is asked. On a scale built from population statistics, that expectation is the wrong test. A band boundary is not a law any two raters must reach; it is a stated summary of where many raters tend to land. This page is scoped to the scale's own reliability only. The separate question of instrument accuracy, whether the underlying measurement is correct in the first place, is answered in full at how we measure attractiveness and where it fails.
What's the Difference Between a Score and a Percentile?
A score is a fixed point on the scale; a percentile is a separate claim about where that point sits in a stated population. A 7 is always a 7 on this scale, the same ten bands apply to everyone measured on it. Where that 7 would land in percentile terms depends entirely on which reference population the percentile is computed against. A percentile without a named, measured reference population is not yet a real number; it is a guess wearing a number's clothes. That is exactly why this site withholds percentiles rather than inventing one, and the table below states that status plainly.
| Attribute | Value |
|---|---|
| Percentile status | Withheld. No real reference population has been measured, and none is invented to fill the gap. |
| Sample size | None yet. No real scan-distribution data exists pre-launch; this is a modeled illustration, not a measured sample. |
| Confidence band | Not yet published. A confidence band requires a completed test-retest reliability study, which has not run. |
| What it is not | A grade, a rank against people you know personally, or a claim about how any one person judges your face. |
Is the Scale Different for Men and Women?
Male and female scores are read against different reference distributions, which is why the identical measured geometry can read differently depending on which distribution it is read against. This does not mean either sex scores better on the scale; it means the scale compares each face to others of the same sex rather than to one combined, sex-blind population. The practice mirrors how most physical measurements work: height percentiles, for one common example, are also computed separately by sex, because a single combined distribution would blur two different typical ranges into one misleading average. The 1-to-10 scale itself, its bands and its notation, stays identical across both distributions; only the reference population behind them changes. A male score of 7 and a female score of 7 both sit in Band 7 on the identical scale. Only the reference population any future percentile would be read against differs.
| Group | Reference distribution | What differs |
|---|---|---|
| Male faces | Scored against a male-only reference population. | The reference distribution any future percentile would use, not the scoring formula itself. |
| Female faces | Scored against a female-only reference population. | The reference distribution any future percentile would use, not the scoring formula itself. |
What About "Rate Me Out of 10" or the PSL Scale?
Rate me out of 10 is the same 1-to-10 attractiveness scale in casual phrasing, while the PSL scale is a separate, subculture-specific scale entirely. Rate me out of 10, rate out of 10, and rate me 1 out of 10 all ask for the identical ten-band scale in imperative, meme-register wording. Nothing about the scale changes because of how the question is phrased. The PSL scale is different in kind, not just in name. It runs 1 to 8 rather than 1 to 10, and the PSL scale, tier by tier covers how each of its eight tiers is defined. Its central honest criticism is that its tier boundaries come from forum consensus rather than from a published, replicable method. Handsomeness is the older, male-coded word for the same concept this scale measures; it names no separate scale of its own. This page uses plain numbers and band descriptions instead of named tiers, on purpose: a tier name invites comparison to a type of person, where a band number only states a position on a distribution. If you arrived asking whether you're pretty rather than interpreting a number you already have, am I pretty answers that directly instead.
Where Does the Number Come From in the First Place?
Everything above this line explains how to read a number you already have; this section explains how to get one. Every register discussed so far, the plain scale, out-of-10 phrasing, PSL, and the male-female split, describes the same underlying score once it exists. The score itself comes from a separate step: an instrument that measures a photo and returns a value on this same 1-to-10 scale.
How to Confirm It: Take the Free Attractiveness Test
Confirm it by taking the AI attractiveness test, the free, on-device scan that maps facial landmarks and returns a score on this same 1-to-10 scale. Nothing is uploaded, and the scan runs on your device, the same claim every measurement on this page assumes but none of them can confirm on its own. Running it costs nothing, needs no signup, and answers the one question this guide cannot: where a specific face, right now, actually falls on the scale. The band table above still applies afterward; the scan supplies the number, and this page supplies what that number means.
What Changes It
Photo conditions move a score immediately; styling and grooming move it moderately; claims about changing bone structure do not move it at all. The table below ranks those three tiers from strongest effect to weakest, the same evidence-ranked order used throughout this site.
| Factor | Effect on the number |
|---|---|
| Photo conditions: angle, lighting, lens distance | Immediate and real. The same face shifts by more than a full band between different photos. |
| Styling and grooming | Moderate. Consistent, evidence-ranked changes worth making; see what actually makes a face read as prettier. |
| Claims about changing bone structure | Do not move it. No photo condition or grooming choice reshapes adult bone. |
What Doesn't Change It
This scale describes a population, not a verdict on any one face, and no re-scan changes that fact. Re-measuring under better light or a more flattering angle moves the number, the score attached to that specific photo. It does not move the scale itself, its ten bands, or the reference population each band is read against. A different number is not a different scale. Nothing on this page, or produced by any scan, states a fact about a reader's worth, only about where one photo lands against a stated population on a given day. That is the honest limit of what any band on this scale can say, and it holds whether the number that came back was a 3 or a 9.
Every figure above traces to a named source: a peer-reviewed study for the research claims, with band rarity stated in plain language because percentiles stay withheld until measured scan data exists. None of the four studies below is presented as the final word on facial attractiveness research. Each is one well-replicated data point in a larger literature, linked by DOI or PubMed ID, so a skeptical reader can check the source directly instead of taking a summary on faith. Every citation here is checked by a person before it ships, and re-checked whenever measured scan data replaces the qualitative band descriptions in this guide.