Am I Pretty? The Honest AI Test and Quiz
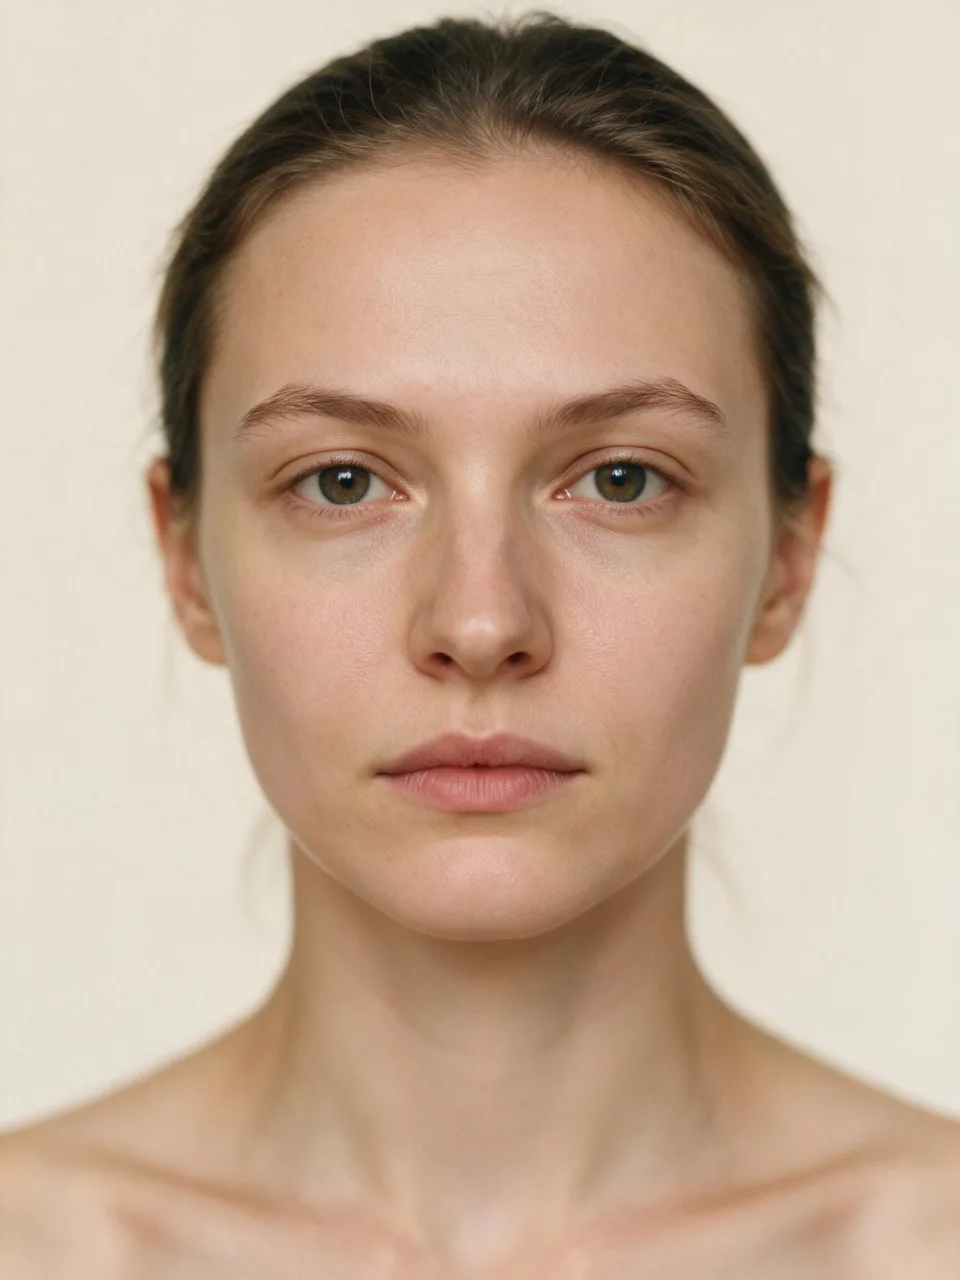
EXAMPLE ANALYSIS: 478 LANDMARKS MAPPED ON A SAMPLE PHOTO, NOT YOURS.
What a reading looks like
Real components · sample dataA starting line, not a verdict.
What we won't show you: a confidence band (not until our test-retest study ships) · a percentile (not until a reference population is published) · a skin score from one photo (lighting lies). Every "not scored" comes with its reason.
A photo test estimates a face's score against population averages; it cannot say who finds you pretty. The scan measures 478 landmarks in your browser, returning a 1-10 score in about ten seconds. The Pretty Test: 12 questions, no photo.
The Short Version
Am I Pretty? What an Honest Answer Looks Like
An honest answer to "am I pretty" is a measurement of named facial traits with its limits stated, not a verdict. It reports what one photo shows, what it missed, and how far the number reaches.
Two claims hold. The scan states how the geometry in your photo compares with population averages on the traits it measures, and it states that the same photo on the same score version returns the same number. One claim does not hold: whether any particular person finds you pretty. Someone typing am I beautiful, am I good looking or am I cute is asking a measurement question and a social question at once, and only the first has a method.
Prettiness, measured, is geometry: distances, angles and ratios between landmarks on one frontal photo. The rest of what the word carries, expression, warmth, the way a face moves while it talks, sits outside the frame. So this page hands you a number with its edges marked, not a label.
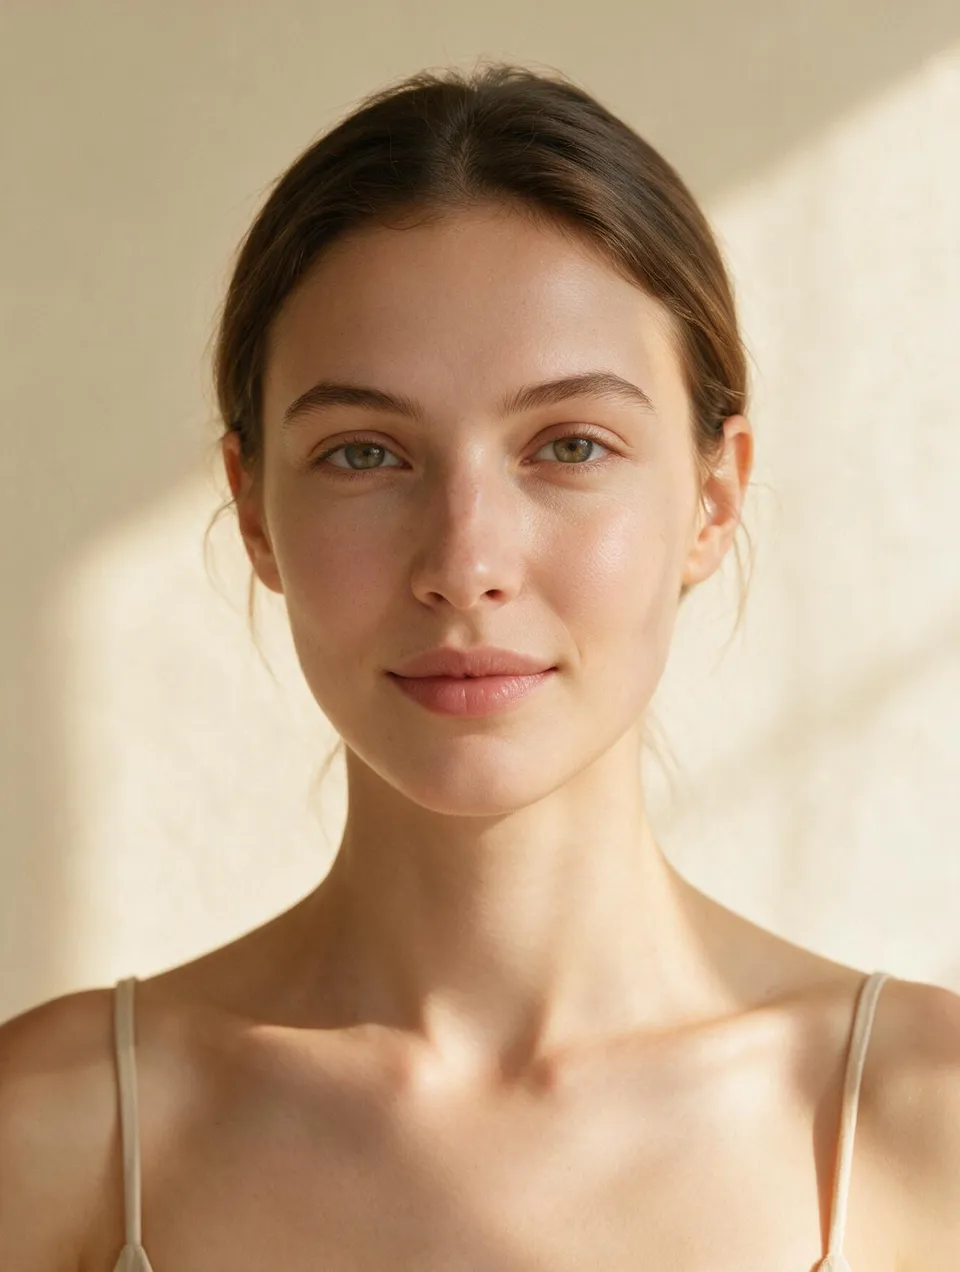
A photograph like this is the kind the scan can read: face on, evenly lit, expression near neutral. The measurement covers the geometry that frame holds, distances, angles and ratios between 478 landmarks. What the frame leaves out, warmth, expression, the way a face moves in conversation, stays outside every number this page returns, and the page says so.
How Can I Tell If I'm Pretty?
You can tell how pretty a face measures by checking four things a photo shows: symmetry, proportion, harmony and apparent age, with camera, distance and lighting held steady while you check.
- Symmetry: how closely paired features mirror each other across a fitted midline.
- Proportion: whether the thirds of face height and the fifths of face width sit near even.
- Harmony: whether the components agree with each other instead of one carrying the rest.
- Apparent age: how old the face reads, measured separately from how old you are.
Checking from a photo works when the photo is measurable. Use the rear camera at arm's length, head straight on, neutral expression, even light on both sides. A picture taken close up on a front camera widens the nose and shortens the jaw, and that alone moves a measured score more than most people expect. The test above runs those checks first and names the conditions that failed, so a bad photo returns a reason instead of a number. Photos never leave your browser while it does that.
What the Scan Measures on a Face
This scan measures symmetry, facial proportion, facial harmony and apparent facial age from 478 on-device landmarks. Symmetry compares paired landmarks across a fitted midline. Facial proportion measures the thirds and the fifths against even division. Facial harmony measures whether those components agree with each other rather than one component carrying the score. Apparent facial age reads beside the score rather than inside it, because how old a face reads and how a face measures are two different claims.
Three things stay unscored on the free pass: skin quality, the side profile and averageness. Skin reads differently under different lighting and camera processing, the side profile needs a second photo, and averageness needs a published reference population. The full component set, with the weight behind every component, sits on the root instrument: test your attractiveness with the full instrument.
Your Score, in Plain Numbers
Your attractiveness score is a 1-10 value with one decimal, computed from the components measured on one photo. Your percentile is a separate claim about where that value ranks in a reference population, and this version publishes neither.
A score answers how one photo measured against a published formula. A percentile answers how that measurement ranks among other people, which needs a stated reference population and its size. A confidence band answers how far one face's number moves between photos, which needs a test-retest study. Neither exists yet at a standard worth printing, so the card shows the value alone and says why.
| The number | What it states | Status in Score v1.0 |
|---|---|---|
| Score, 1-10 | How one photo's components combine under the published weights | Printed on every result |
| Percentile | Where that score ranks in a stated reference population | Withheld until the population and its size are published |
| Confidence band | How far one face's score moves across photos | Withheld until the test-retest study is run |
A percentile without a stated population is decoration, and a band without a study is invented, so both rows stay blank until they are real.
Am I Pretty? Take the Quiz Instead
A 12-question quiz cannot see your face, so The Pretty Test reports how your own estimate compares with how people typically estimate themselves and sends everything about the face itself to the photo test. It runs in under 90 seconds, asks for no photo, no email and no account, and loads no model at all.
The questions run in four blocks of three. The first asks what you estimate about your own appearance and how sure you are. The second asks for observations you can make without a mirror, like whether one side of your smile sits higher. The third asks about the camera, distance and light in the photos you judge yourself by. The fourth asks about context, is never scored, and only decides whether the support block opens by default.
The result names the traits you flagged as uncertain and offers the measured version. The table compares three honest ways to answer this question.
| Method | What it uses | What it can honestly tell you | What it cannot |
|---|---|---|---|
| The photo test | 478 landmarks from one frontal photo, on your device | How your geometry scores against a published formula | Whether one person finds you pretty |
| The Pretty Test | 12 questions about your estimate and your photo habits | Where your estimate sits against how people estimate themselves | Anything about your face, which it never saw |
| Asking people you trust | The judgement of people who see you move and talk | How you read in person, over time | A number you can repeat or track |
Each method answers one part and none answers all three. The quiz articles ranking for this question print a verdict about a face they have never seen.
Am I Pretty or Ugly?
Am I pretty and am I ugly are one measurement asked from two directions, and this instrument answers both with the same number, the same components and the same care. The scan holds no verdict vocabulary in either direction: it reports geometry, the conditions that moved it, and what it never measured. A low value is not a label and a high one is not a promise.
If your framing is the negative one, am I ugly asks the question in its own words. It runs the same engine and the same score version, so a value from one page matches a value from the other on the same photo. Typing both words into one search is one question with two endings, and this page answers it once.
Pretty Faces: What the Evidence Says and What It Doesn't
Raters agree about which faces are attractive far more than the eye of the beholder suggests. According to Langlois and colleagues in Psychological Bulletin, 2000, a review of 11 meta-analyses found agreement among raters inside one culture at about r = 0.90 [1]. What that does not license: treating one score as everyone's opinion. Hönekopp, in the Journal of Experimental Psychology, 2006, found private taste accounts for roughly half the variance in how individual faces get rated [2].
Agreement crosses cultures and weakens. Coetzee and colleagues, in PLOS ONE, 2014, had African and Scottish observers rate the same 179 faces. Their ratings correlated at r = 0.62 overall, r = 0.75 on Scottish faces and r = 0.49 on African faces [3]. What that does not license: calling any face universally beautiful, because agreement runs strongest where raters and faces share a background.
Your own estimate is the weakest predictor here. Arnocky, in Evolutionary Psychology, 2018, compared 139 men's ratings of their own looks with women's ratings of their faces and found a correlation of r = 0.04, which is no relationship at all [4]. What that does not license: assuming the measurement is right and you are wrong. Your estimate and other people's ratings are separate numbers, which is why The Pretty Test reports the gap.
Is the Am I Pretty Test Accurate?
The am I pretty test is reproducible: the same photo and the same score version return the same number, to the decimal, on any device.
Reproducible is a narrower claim than accurate, and the narrower claim is the one this instrument defends. Accurate would mean the number matches how people actually rate your face, which needs a rater study this AI facial analysis has not run. What it defends instead: the method is disclosed, the weights published, the version stamped on your result, and a photo that fails the validity gate returns a named reason. Change the photo and the number moves, which is a fact about photographs. The statistics, and the places the method fails, sit in how we measure attractiveness.
What This Score Cannot Tell You
This score measures one photo against one aesthetic tradition, and six limits bound everything above.
None of that makes the number worthless. It makes the number a starting line and not a verdict.
That is the full account of both instruments, and the rest of this page is about the answer you just got.
Where Does an Honest Answer Leave You?
An honest answer leaves you with three things: a number you can check, a short list of what moves it, and a longer list of what it never touches. The three sections below take them in that order, whichever mode produced your answer.
How to confirm it
A 7 out of 10 is above average on this scale. It sits above the midpoint, in the band where most measured components land near or above balance, and it describes a photo's geometry rather than a person.
The bands are fixed site-wide, so a 7 here carries the same meaning as a 7 on every other instrument on this site, and none of them carries a tier name. The full ladder, and the research behind each boundary, is in what your score means on the 1-10 scale.
Verifying your own answer takes three steps and about two minutes.
- Retake the photo with the rear camera at arm's length, head straight on, in even light.
- Re-run it on the same score version, so one formula produced both numbers.
- Compare the two numbers rather than the two faces, and read the gap as a photo-condition result.
Two photos taken minutes apart that return different numbers have told you about your camera.
What it changes
Three tiers of change act on a measured score, ranked by evidence rather than by how loudly they are sold.
- Immediate and quantified: photo conditions. Camera distance, lens, head angle and lighting move the measured value inside a single session.
- Moderate and real: grooming, sleep and styling. Hair that changes the visible outline, brows and a rested face shift harmony and apparent age.
- No measurable effect: bone claims. Mewing, chewing devices and jaw training do not remodel adult facial bone.
That order holds across the evidence and it is the order to work in. Each tier is ranked in detail in the evidence-ranked routes to a prettier face.
What it does not change
A score does not change how anyone who already knows you sees you. Familiarity, expression and everything a face does in conversation sit outside the frame the scan measured, and that is what the people around you respond to. Most measured faces land near the middle of the scale, which is a fact about the distribution rather than a comment on yours. A number that moved after a better photo has told you about the photo.
If the Answer Hurts
Some people open this page on a bad day, and the answer lands harder than a number should. If that is you, this passes faster with a person than with a screen.
If You Asked a Different Question
The full attractiveness test asks this question without the first person: the whole component set on one photo, every weight published, and the longest treatment of the method on this site.
Rate my face turns the same scan into a rating you can keep or post, and it is where people land when they want to rate your face rather than ask about it.
The 1-10 scale guide answers what a given number means, band by band. Interpretation lives there; measurement lives here.
The Pretty Scale page covers the 2013 tool that still ranks for this question, and where its method parts ways with a landmark mesh.
Not medical advice. This is a measurement of a photo, not a diagnosis, a clinical assessment, or a verdict on you.
It measures geometry, not worth. The number tells you where you start. It never tells you what you are.
on every page
of this site
Frequently Asked Questions
What is considered a beautiful face?
A beautiful face, in the research, measures high on four recurring traits: symmetry, even proportions, features that agree with each other, and apparent youth. The weighting between those traits shifts with culture and era.
Do I look good?
A photo can be measured and a room cannot: one is geometry held still, the other is movement and expression over time. This scan answers the first and leaves the second alone.
Am I cute, pretty, or hot?
Cute, pretty and hot are three registers for one measurement, and this instrument does not tell them apart: the same geometry returns the same value whichever word you searched. The difference lives in expression, styling and context.
What type of pretty am I?
This instrument classifies measurable features rather than aesthetic types: it reports face shape, eye shape and your proportion set, and sorts nobody into a category. Type language comes from styling traditions built on these measurements.
Am I pretty without makeup?
The scan measures geometry, and lighting, camera distance and lens change measured geometry far more than cosmetics do. Photograph one face on two cameras and the flags will name which comparison you made.
Am I pretty enough?
No measurement answers enough, because enough compares you to a standard the question has not named. The scan reports where one photo's geometry sits, and it holds no threshold you are meant to clear.
Is there an honest "am I pretty" quiz?
An honest quiz reports your own estimate rather than your face, because a quiz has never seen you: The Pretty Test returns a self-perception calibration and routes the face itself to the photo test. A quiz printing a beauty score from 12 questions is guessing.
Am I pretty or not?
A measurement returns no yes or no: it returns a 1-10 value from one photo, the components behind it, and the conditions that moved it. The percentile and the confidence band stay withheld until a reference population and a test-retest study exist.
Am I pretty for my age?
Apparent facial age is measured separately from the attractiveness score, so the two read as different claims rather than one adjusted for the other. A face age tool estimates how old a face reads; the score never corrects against your birthday.
References
Every claim above, traceable
- Langlois et al., Psychological Bulletin 2000 - meta-analytic review across 11 meta-analyses: raters agree about who is attractive at about r = 0.90 within cultures, and agreement holds across cultures.
- Hönekopp, Journal of Experimental Psychology: Human Perception and Performance 2006 - private taste accounts for roughly half the variance in facial attractiveness ratings.
- Coetzee et al., PLOS ONE 2014 - African and Scottish observers rating the same 179 faces agreed at r = 0.62 overall, r = 0.75 on Scottish faces and r = 0.49 on African faces.
- Arnocky, Evolutionary Psychology 2018 - among 139 men, self-rated good looks correlated r = 0.04 with women's ratings of the same faces.
- Buolamwini and Gebru, PMLR 2018 - commercial classifiers showed error rates up to 34.7% for darker-skinned women against 0.8% for lighter-skinned men.
- Grother, Ngan and Hanaoka, NIST IR 8280, 2019 - face recognition false-match rates ran 10 to 100 times higher for some demographic groups.